-
5. Instruments mitigating external vulnerability (FFAR, FECR, IFR)
-
7. Capital buffer of systemically important institutions (OSII-B)
-
11. Financial stability risks of climate risk and options for their macroprudential management
-
12. The systemic significance of cyber risks and the potential risk management options
1. Executive Summary
2. Countercyclical Capital Buffer (CCyB)
2.1. Cyclical systemic risks have been stagnating at a low level during the past year, which have not justified the imposition of a higher-than-1-per-cent CCyB rate
The Cyclical Systemic Risk Map (CSRM) has, during the past year, been showing cyclical systemic risks stagnating at a low level, with increasing risks – jeopardising financial stability – in the categories measuring excessive competition and overvaluation of investment instruments (e.g. collateral) (Chart 1). The “excessive competition jeopardising financial stability” category is indicative of a modest (yellow) risk, primarily as a consequence of the low level of household lending margins and the high levels of bank profitability. The indication of an increase in risks is justified by the fact that the low interest margin and the high profitability are not sustainable and might entail excessive market risk taking. However, current risk predictions are indicative of low housing loan margins relative to the funding costs, stemming from the prevailing higher interest rate environment, along with strong profitability and not overly excessive risk appetites, resulting from lenders’ “interest coverage” enabled by a high ratio of deposit financing. In other words, banks compensate for low lending margins by paying low deposit rates. In the medium (orange) risk “overvaluation of investment instruments” category, indicators (collateral) linked to housing market risks, and those measuring households’ investments in risky financial instruments, particularly investment funds, have increased somewhat. According to the CSRM indications the elevated housing market risks may persist even in a longer run, and they continue to call for increased monitoring.
Chart 1: Development of average values of risk indicators within CSRI risk groups
Source: MNB
The Cyclical Systemic Risk Index (CSRI) has remained near its average value in across observation periods since 2022, indicating a neutral level (Chart 2). Among the eight most important cyclical systemic risk indicators underlying the CSRI, the MNB house price gap indicator and the indicator measuring households’ investments in riskier financial instruments – particularly investment funds –, signal elevated risks, while the remaining indicators reflect lower risk levels. Looking ahead, a gradual improvement in the macroeconomic environment and an upswing in lending are expected along with growing cyclical systemic risks.
Chart 2: The development of the CSRI

Note: The CCyB rate is a rule-based rate determined based on the CSRI, from which the MNB may deviate if necessary, taking into account the indicators of the CSRM and other relevant factors. The lower and upper thresholds are the 7th and 9th deciles of the CSRI values. The box-plot chart on the right depicts the minimum, maximum, interquartile and median values of the historical distribution of the CSRI. Source: MNB
In view of the overall low level of the cyclical risks, the MNB decided to maintain the CCyB rates for domestic exposures in its quarterly rate decisions throughout 2025, as there was no justification for setting rates above the positive neutral rate. The MNB kept the 0.5-per-cent CCyB rate in place, which had been applicable since 1 July 2024 and confirmed its decision to apply a 1-per-cent CCyB rate in a neutral risk environment from 1 July 2025, maintaining this level from 1 October 2026 as well.
2.2. In view of the uncertain environment, EEA countries are raising CCyB requirements
Due to the increased financial stability risks, most EEA countries are increasing their macroprudential capital buffer requirements. The 1-per-cent CCyB rate in place since 1 July 2025 in Hungary is considered average in international comparison. By end-June 2025, positive CCyB rates had been announced in 25 EEA countries. Five EEA countries continue to apply a 0-per-cent CCyB rate, while all CEE countries have introduced a positive CCyB rate (Chart 3). 17 EEA countries apply or plan to introduce positive neutral CCyB frameworks for local exposures, with rates ranging between 0.5 per cent and 2.5 per cent. However, most CEE countries apply a 1-per-cent positive neutral rate. Five countries maintaining a 0-per-cent CCyB rate for local exposures, primarily due to declining cyclical risks and negative credit-to-GDP gap ratios, while some of these countries apply systemic risk buffers (SyRB) to their total exposure values.
Chart 3: CCyB requirements for exposures in EEA countries (June 2025)

Note: Buffers which were announced but not necessarily in effect. CCyB rates shown are for exposures in the country. *Countries that apply a framework that can be considered a positive neutral CCyB rate. Source: ESRB, websites of national authorities
A significant proportion of domestic institutions’ consolidated CCyB requirements is consists of CCyB requirements imposed by other countries. An institution-specific CCyB rate is calculated as the weighted average of the rates applicable based on the geographical location of the counterparties associated with significant credit risk exposures faced by the institution. Domestic banking groups – particularly those with Hungarian parent companies – are active not only in Hungary but also in cross-border operations through subsidiary banks in other EU countries and third countries. Positive CCyB rates are in effect not only in an increasing number of EU Member States but also in third countries that are important to the domestic banking system. Consequently, by 30 June 2025, nearly 64 per cent of the CCyB set aside in the domestic banking system had to be generated by domestic banks in relation to international exposures. The total amount of CCyB in the domestic banking system has been rising since 2023, driven by the continuous increase in capital requirements linked to domestic banks’ significant EU exposures. This was further reinforced by the introduction of a positive neutral CCyB rate for domestic exposures – 0.5 per cent from 1 July 2024 and 1 per cent from 1 July 2025 (Chart 4). Considering the 1-per-cent domestic CCyB requirement and excluding any potential increase in non-domestic rates, the total CCyB now originates in nearly equal proportion from domestic and non-domestic exposures. Nevertheless, even after the introduction of the domestic CCyB rate, the specific CCyB burden on domestic exposures remains lower than that on international exposures (0.82 per cent vs. 1.07 per cent). This decreased difference weakens the incentive to adapt, although it does not rule out a gradual – and so far not widely observed – portfolio restructuring toward countries with materially different CCyB rates.
Chart 4: Development of domestic and non-domestic CCyB

Note: Only the increase in the Hungarian rate from 1 July 2025 is taken into account, not the possible expected change in the rates of other countries. The difference between the applicable domestic CCyB rate (1 percent) and the domestic CCyB rate proportional to the TREA is due to the fact that when calculating institution-specific CCyB rates, the CCyB rates related to individual country exposures must be weighted not by the TREA, but by the credit risk exposures to be taken into account in the CCyB rate calculation, thus the difference is explained by the different distribution between the TREA and these credit risk exposures. Source: MNB
2.3. Banks’ strong capital position ensures lending capacity remains unaffected
Owing to banks’ robust capital position and profitability the imposition of a higher capital buffer does not materially weaken their lending capacity. Based on the capital position as of 30 June 2025 – and considering the increase in the domestic CCyB rate from 0.5 per cent to 1 per cent effective from 1 July 2025, while assuming all other factors remain unchanged – approximately HUF 2,600 billion free capital, including uncapitalised interim profits is available at sector level (Chart 5). The full utilisation this amount could support the disbursement of household and corporate loans totalling around HUF 33,000 billion, assuming the household-to- corporate exposure ratio and average risk weights remain fixed, and that the TREA increase can be absorbed using the free buffer. The 1-per-cent CCyB rate – raised by 0.5 percentage point and effective since 1 July 2025 – may result in an additional capital requirement of HUF 115 billion. Its impact on mortgage loan interest rates, assuming a 35-per-cent favourable risk weight and a 12-per-cent cost of capital, would be negligible, estimated at 0.04 per centage point increase on average.
Chart 5: Development of macroprudential capital requirements and the capital position

Note: Estimate focusing solely on the change in combined buffers, ignoring other additional supervisory capital requirements affecting free buffers (e.g. potential change in Pillar 2 capital, P2G, etc.) and the MREL requirement, as well as expected changes in lending and profitability. Not considered profit: the non-recognized part of the mid-year or year-end profit. Source: MNB
BOX I: Quarterly CCyB rate decisions supported by MNB’s revised cyclical system risk monitoring system since December 2024
Based on its June 2024 decision, the MNB determines the applicable CCyB rate to institutions using the prevailing benchmark CCyB rate, the positive neutral CCyB rate of 1 per cent (applicable since 1 July 2025 in a neutral risk environment), and all other relevant factors.
Chart 1: The process of the quarterly CCyB-rate decisions

Source: MNB
The MNB has, since 2024 Q4, been making decisions on the CCyB rate for domestic exposures based on revised methodology. Accordingly, the MNB has extended and restructured the so-called cyclical systemic risk map (CSRM) used to monitor changes in domestic cyclical risks, on this basis, developed the cyclical systemic risk index (CSRI).
The new CSRM tracks 58 indicators – significantly more than the previously version - providing a more comprehensive picture of cyclical systemic risk developments. The CSRM presents the indicators in a renewed structure: (1) credit institutions, (2) borrowers, (3) investment instruments (collateral) and (4) international categories, further broken down into sub-categories. Risk indicators have been classified using colour codes: low (green), moderate (yellow), medium (orange), high (pink) and persistently high (red).
To facilitate interpretation, the CSRM indicators are aggregated in a single measure, called the Cyclical Systemic Risk Index (CSRI). A so-called Growth-at-Risk (GaR) model was first estimated to identify the indicators that best predictions potential domestic real economic crises over an 8-quarter horizon.1Subsequently, the selected indicators were aggregated using a factor model. The final index is calculated as the average of the resulting three most significant factors, weighted by their explained variance ratios.
As part of the renewal of the cyclical systemic risk monitoring system, the so-called benchmark CCyB rate, which is determined by cyclical risks, has been calculated since 2024 Q4 based on the CSRI instead of the additional credit-to-GDP gap. The CSRI enables a more accurate and less uncertain measurement of cyclical risk growth compared to the previously applied additional credit-to-GDP gap, reducing regulatory uncertainty (inaction bias) through more reliable predictions, and allowing earlier and quicker establishment of the CCyB requirement. The MNB calculates the benchmark CCyB rate by considering both the rule-based rate which is derived from the CSRI and the CSRM indicator signals.
The MNB has improved the transparency of its CCyB decisions by publishing the underlying indicators. The MNB informs the public about its CCyB decisions by disclosing the methodology used to determine the CCyB, through press releases, publishing the underlying professional justification and, since 2024 Q4, by publishing the values of the indicators underlying the decisions, along with the aggregated risk indicators for the relevant indicator groups, in the form of time series.
3. Borrower-based measures
3.1. With the current expansion of household lending, borrowers’ income burden is on the increase, but it cannot be regarded as excessive yet
Household lending grew dynamically during 2025 H1. Banks disbursed household loans in an amount of about HUF 1,648 billion during that period (Chart 6), up to 33 per cent year-on-year. In the first half of the year housing mortgage lending amounted to HUF 808 billion, exceeding the all-time high recorded in 2022 H1 and up to 26 per cent year-on-year. Consumer lending increased by an even more remarkable 41 per cent during the same period, partly as a result of the introduction of the so-called Subsidised Loans for Workers Programme, which amounted to HUF 107 billion new loans in just half a year. Personal loans grew by 40 per cent year-on-year, while the amount of prenatal baby support loans dropped by 13 per cent. In spite of the rapid credit outflow, the volume of household lending – adjusted for inflation – increased by less than 2 per cent relative to the amount recorded in 2020 H1; therefore, the robust nominal growth in lending does not, in itself, constitute a risk factor.
Chart 6: The development of new household lending by loan type

Note: Credit institution sector. Without individual entrepreneurial loans. Source: MNB
The volume-weighted average of debt-service-to-income ratio (DSTI) has increased in 2025. The volume of household loans, which is clustered around the DSTI limits, has been gradually expanding, in particular, in the housing loan segment. While in 2019, banks disbursed about 20 per cent of housing loans at a high DSTI of over 40 per cent, in 2025 H1, this proportion nearly doubled, ending up at 36 per cent (Chart 7). Due to steady house-price increase, and an increase in repayment costs caused by still high e housing loan rates despite of the normalisation process, the income burden is growing by volume. This process is also driven by the fact that the higher – 60-per-cent – DSTI limit applying to borrowers with incomes exceeding HUF 600,000 is becoming accessible for more and more borrowers as a result of the rapid increase in nominal wages that has been observed during the recent years (the effectiveness of the DSTI income limits is discussed in detail in Sub-chapter 2.3). Nevertheless, the risks stemming from the DSTI burden are mitigated by the fact that in terms of the number of contracts the income burden has been growing less dramatically; in other words, the risk of income-stretched loans is associated with a smaller group of borrowers, many of whom are in a better than average income position and apply for loans of larger than average amounts.
No further increase in collateral encumbrance is currently envisaged but seems to be likely in a longer run. The weight of housing loans with low down payment, i.e. with loan-to-value ratios (LTV) over 70 per cent in new loan disbursements was about 30 per cent in 2025 H1, more or less the same as during the corresponding period of 2024. Looking forward, however, loans disbursed with lower down payments may increase collateral encumbrance through the expected increase in the number of first-time home buyers entering the market due to the Home Start Programme; therefore, the housing loan market processes need increased monitoring.
Chart 7: The development of new residential mortgage lending near borrower-based measures limits

Note: By volume: * Overlap is possible between loans granted with DSTI above 40% and LTV above 70%. Source: MNB
On the whole, household lending is currently taking place in a healthy structure, in accordance with the borrower-based measures, denominated in forints and with interest rates fixed over longer period. However, borrowers’ income stretch is on the increase gradually and steadily. Therefore, the MNB continuously monitors the changes in the lending processes, partly in view of the potential rise in demand for loans under the Home Start Programme.
Regarding the rise in real estate market risks, in September 2025, the MNB adopted a comprehensive package of proposals to tackle mortgage loan market risks. This included decisions on raising the nominal thresholds relating to the DSTI requirement, and on fine tuning the loan-to-value requirement to be met by first-time home buyers.
3.2. The increased LTV limit applying to first-time home buyers did not result in a material rise in credit risks
The MNB imposed a lower down payment requirement, i.e. a higher, 90-per-cent loan-to-value limit, for first-time home buyers from 1 January 2024 and for green real estates from 1 January 2025. In 2024, loans provided for first-time home buyers with 80–90-per-cent LTV ratios accounted for about 4 per cent of the total new residential mortgage lending, comprising 1,700 transactions, while the total number of loans provided for first-time home buyers is estimated to have been around 10,000. Accordingly, some 15–20 per cent of first-time home buyers eligible for the higher LTV limit may have taken out their housing loans with less than 20-per-cent down payment. The proportion of loans provided in 2025 H1 with 80–90-per-cent LTV ratios was somewhat higher than 5 per cent (Chart 8, left-hand-side panel), partly because of the higher LTV limits made available from the beginning of 2025 for green loan purposes. Of the total portfolio of loans provided, most – some 4.8 per cent – of the loan applications submitted with LTV ratios over 80 per cent had been extended to first-time home buyers, 3.2 percentage point of which were green loans. On the other hand, in 2025 H1, the proportion of green loans applied for with over 80-per-cent LTV ratios by non-first-time home buyers was a marginal 0.4 per cent of the total new residential mortgage lending (Chart 8, right-hand-side panel).
Chart 8: The development of new residential mortgage disbursements by volume according to LTV (left panel) and by first-time buyer and green status in the first half of 2025 (right panel)

Note: In the right panel, the categories First-time buyer, Green, and First-time buyer-Green show the borrowers taking advantage of the discount. Source: MNB
The data of the first 1.5-year of the preferential rules show that first-time home buyer LTV requirement probably came as a considerable help to young borrowers with limited funds of their own but adequate income, in achieving their housing objectives. The income of first-time home buyers is usually not as stretched as that of a non-first-time home buyer borrower, partly because of the higher proportion of borrowers not having any loans among first-time home buyers (Chart 9, right-hand-side panel). Thanks to the lower interest rates and, consequently, to the larger accessible loan amounts, the proportion of first-time home buyers making use of the over 80-per-cent LTV in the case of state subsidised loans is higher (22 per cent) than in the case of non-state subsidised loans (12 per cent). No material geographical differences by collateral encumbrance can be identified.
Owing to the borrowers’ lower income stretch, the limited volume of such loans within the total residential mortgage lending and the presumably lower credit risk associated with the customers concerned; therefore, the more favourable LTV limit introduced for first-time home buyers does not result in any material increase in the systemic risk, on the whole.
Chart 9: The evolution of new mortgage lending contract by income (left panel) and by DSTI (right panel)

Note: Data for 2024 and the first half of 2025. Source: MNB
The Home Start Programme – launched in September – may drive the proportion of loans with low down payments in the total volume of new loans even higher. On account of the favourable interest rates available under the Home Start Programme in the case of the eligible borrowers, the amounts borrowed is expected to be maximised relative to the borrowers’ income positions and the collateral concerned, which may lead to an increase in collateral encumbrance and in the proportion of loans provided with high – 80–90-per-cent – LTV ratios. However, the risks of the processes are mitigated by the product’s interest rate which is lower than the market rate and fixed for the entire term, along with the lower income burden of first-time home buyers than that of other borrowers.
To ensure smooth lending processes, the MNB modified the conditions for the accessibility of the higher LTV limit for first-time home buyers on 1 September 2025. Under the modification, the MNB removed the 41-year age limit prescribed in relation to the 90-per-cent loan-to-value limit pertaining to first-time home buyers with effect from 2 September 2025. The removal of the age limit supports the smoothness of the lending processes in the evolving market environment without triggering an increase in risks, since the higher LTV limit will continue to be accessible for customers with shares of ownership below 50 per cent, wishing to make their own homes and, therefore, more willing to repay their loans. The efficiency of lending processes will be improved by lenders having to identify first-time home buyers who are eligible to higher loan-to-value ratio limit, with significantly less cumbersome administrative formalities, by querying from the land register, from December 2025.
3.3. The MNB continuously monitors the efficiency of and institutions’ adaptation to the borrower-based rules, and is fine-tuning the regulation as necessary
The nominal wage increases during the past two years are eroding the effectiveness of the DSTI income threshold, which may drive lending risks up. The DSTI income threshold set at HUF 600,000, allowing a higher-than-50-per-cent income burden, was last revised in July 2023. The average income of mortgage loan borrowers, during the more than two years since then, has increased from HUF 746,000 to HUF 875,000. The proportion of borrowers eligible for the 60-per-cent DSTI limit has, in the meantime, increased from 65 per cent of new housing loans in 2023 to 80 per cent in early 2025. The increase in the percentage of borrowers eligible for the higher DSTI limit has been accompanied by a rise in the actual usage of the limits: the proportion of new loans with higher-than-50-per-cent DSTI has increased from around 10 per cent in 2023 to 12 per cent (Chart 10).
Chart 10: The development of new residential mortgage disbursements by DSTI income

Note: By volume * 2025 first half data. Source: MNB
To maintain the effectiveness of the DSTI requirement the MNB has raised the DSTI income threshold. In view of the dynamic nominal wage increases that have been observed during the past years and that are expected to continue, the MNB has adopted a decision on raising the DSTI income threshold from the current HUF 600,000 to HUF 800,000 with effect from 1 January 2026. The raising of the income limits is justified by both the increase in the nominal incomes and borrowers’ growing income burdens. The raising of the DSTI income threshold helps to prevent over-indebtedness without material negative impacts on the credit market, by withholding excessively risky loans.
No material increase in the financing of down payments with uncovered personal loans is experienced. The share of personal loans disbursed 180 days prior to taking out a housing loan, which is likely to finance the down payment, or the associated costs of home purchase is stable at 3–4 per cent of residential mortgage lending from 2020 H2 (Chart 11). The decrease was supported by the MNB’s executive circular issued in 2019 for institutions as a guidance for the assessment of own contributions (available in Hungarian only), the prenatal baby support loans available from 2019, and the higher LTV limits made available for first-time home buyers from the beginning of 2024.
Chart 11: Estimated development of personal loans used to replace self-reliance

Note: The ratio of mortgage lending by contract number within the disbursement of each LTV category, for which the principal debtor took out a personal loan as well maximum 180 days before the conclusion of the mortgage contract. Without prenatal baby support loans. Source: MNB
As regards housing loans, the shift towards longer-term loans by borrowers with a high income burden appears to be stabilising. Borrowers can also adjust to high repayments by extending the maturity. The difference between the average maturity of income-stretched housing loans with a DSTI above 40 per cent and that of housing loans with lower DSTI, is around 3.5 years in 2025 H1 like in earlier years; the proportion of loans with shorter than 15-year terms among loans with higher-than-40-per-cent DSTI decreased somewhat (Chart 12). However, the average maturity is not considered risky even in the case of the 20.4-maturity that is characteristic of more income-stretched loans. No significant maturity extension was observed for consumer loans.
Chart 12: Development of the maturity of housing loans at the time of contract conclusion according to DSTI stretch

Note: For 2025, data refer to the first half of the year. Includes only housing construction and purchase loans, excluding renovation and expansion purposes. The violin plot illustrates the distribution of data by loan maturity, while the box plot shows the interquartile range (IQR) and the 1.5×IQR values. Source: MNB
BOX II: Model development efforts aimed at strengthening the housing market risk monitoring system
An excessive and persistent increase in house prices and households’ related indebtedness may trigger the development of massive systemic risks in the financial system. As precise and as rapid forecasting of housing price dynamics as possible may thus contribute significantly to the development of more effective and rapid policy responses. However, due to the rapid changes in the economic environment and occasionally to substantial delays in reporting, conventional models that are based on quarterly data can only indicate the build-up of risks with significant delays. In response to these challenges the MNB has developed an advanced 2-pillar modelling framework which provides for more accurate and timely support for decision making.
The MNB’s monitoring system for housing market forecasting relies on two mutually complementary econometric models:
The primary purpose of the earlier developed Lasso quantile regression model (QR Model), presented in the May 2025 Housing Market Report, is to map risks and extreme outcomes, rather than the central trajectory. The “LASSO” procedure in the name of the model is an automated variable selection technique that is capable of selecting, from the potential explanatory factors, the ones that are the most relevant to housing price dynamics, making the model even more robust. Its key characteristic is that it is capable of providing stable forecasts particularly during periods of high volatility and uncertainty when the assessment of downside risks is most critical. The model enables quantification of the “House-price-at-Risk” (HaR) type risk indicators showing the potential extent of a negative market shock.
The key innovation of the other newly developed mixed frequency Bayesian state-space model (MF-BVAR) is bridging the information gap between different data supply cycles. The Bayesian approach improves the model’s performance particularly in cases when work is carried out with a large number of explanatory variables and relatively short time series, as is often the case in housing market modelling. The model utilises information on data series persistence with the help of the so-called Minnesota prior which is capable of efficiently managing large numbers of parameters to be estimated, thereby improving the accuracy of forecasting. The model analyses the evolution of house prices in a complex system consisting of twelve variables, combining quarterly data (e.g. MNB house price index, long-term unemployment) with monthly indicators (e.g. credit outflow, transaction number, financial stress index). The model is thus ideal for nowcasting, i.e. for highly accurate forecasting of housing price dynamics for the current quarter, thereby enabling more accurate short-term forecasting of the most likely housing price trajectory. This enables decision makers to work with a nearly real-time picture of the current state of the market. Two separate models have been developed in order to forecast national and Budapest housing price trends, incorporating data specific to Budapest (where available) in the case of the capital.
The mixed frequency MF-BVAR model enables more accurate forecasts by using longer time series. To verify the effectiveness of our forecast, we also worked out our forecast for the capital city, starting from 2024 Q2 and Q4. In the case of the forecast starting in 2024 Q2 (Chart 1, left-hand-side panel), where the MNB’s nominal house price index data are available until 2024 Q1, the longest one of the monthly data series lasts until August 2024. In this case the forecast produced by the QR model is also close to the MF-BVAR median estimate, within its 20–80-per-cent confidence range. In the case of the estimate starting in 2024 Q4 (Chart 1, right-hand-side panel), where the MNB nominal house price index is available until 2024 Q3, the MF-BVAR model forecast remains close to the actual data on account of the use of monthly information which continues to be available for another four–six months, while the QR model forecast, which uses only quarterly data, i.e. less information, lags significantly behind the MF-BVAR model forecast and the evolution of the actual data. These two estimates indicate the necessity of the mixed frequency model and the scenario in the case of which it provides significantly more accurate forecasts than quantile regression does. No major trend reversal was observed in real estate prices in 2024 Q1, but the increase of prices accelerated significantly from 2024 Q3. In the latter case it was largely due to the use of monthly data available in near real-time that the forecast followed the acceleration of the price rise with a 1-month lag, i.e. almost in real-time.
Chart 1: Mixed frequency forecast of the Budapest MNB house price index starting from the second quarter of 2024 (left panel) and the fourth quarter of 2024 (right panel)

Note: All time series start in January 2013 in the mixed frequency model. The end date of the monthly data is not balanced, for example, in September 2024 it changes between June and August 2024, while the quarterly data, including the MNB house price index, were available in the same time window until the first quarter of 2024. Our model cannot explicitly take into account the impact of the Home Start Program in September in the latest data update, as it is a time series model and is based on past data, but the recently increased demand is already reflected in the results. Source: MNB
The application of the two models together provides a completer and more reliable picture of the housing market processes. Their close interrelationship is indicated by the fact that the set of variables used in the MF-BVAR model was worked out on the basis of the Lasso model’s variable selection results. The mixed frequency model thus sets out the most probable short-term trajectory of house prices, while quantile regression plots the risk zones along this trajectory. This dual approach directly contributes to a more effective macroprudential policy, since the forecasts based on near-real-time data serve as early warning signals, enabling proactive response. Moreover, knowledge of both the central trajectory and the level of risks helps to fine tune the macroprudential instruments (e.g. borrower-based measures).
4. Basel liquidity and funding rules
4.1. The banking sector continues to have a significant short-term liquidity surplus
The LCR – which ensures the banking system’s short-term liquidity on the regulatory side – was at a stable high level during the past year, although with a modest decrease in the liquid asset surplus. After a modest decrease in the past year, the sectoral LCR calculated on individual compliance is still high: 166 per cent according to data as of 30 June 2025 (Chart 13). The banking system’s consolidated LCR was 189 per cent during the same period. During the 1-year period covering the first half of 2024 and the second half of 2025, every individual bank achieved LCR levels of 130 per cent, along with consolidated compliance levels of over 140 per cent, typically in connection with a modest decline in – primarily maturing collateralised long-term MNB – loans. Although every bank complies with the regulatory requirements, liquidity in the banking system is not evenly distributed among the institutions, which may, in some cases, require more active liquidity management. The entire banking system has a surplus of liquid assets in an amount of about HUF 7,400 billion, in excess of the 100-per-cent minimum requirement. According to the MNB liquidity stress test results the liquidity surplus of the domestic banking sector would sufficiently cover the regulatory requirements even in the case of a severe stress.2
Chart 13: Development of institutions’ LCR

Note: The 10th and 90th percentile, first and third quartile values and averages are represented, based on solo compliance data. Excluding mortgage banks and housing savings banks. Source: MNB
Significant changes can be observed in the factors – primarily in liquid assets – determining the evolution of the LCR and its long-term structural change. The decrease in the volume of liquid assets and their restructuring have been driven during the recent period by the diminishing of the stock of central bank discount bills held by banks on their own accounts (central bank assets), the shrinking of banks’ liquidity held on the central bank reserve account (withdrawable central bank reserves) and a lower rate of increase in the MNB's eligible government securities holdings (general government assets). The latter may have been driven by the optimisation of banks’ extra profit tax, resulting, for instance, in a decline in the stocks of central bank discount bills held by banks on their own accounts (Chart 14).
Chart 14: Development of LCR's liquid assets and net outflows

Note: Liquid assets calculated based on solo compliance. Data excluding mortgage banks and housing savings banks. Source: MNB
Banks are adequately meeting the additional LCR liquidity requirements imposed by the MNB in 2023 under its supervisory powers. The MNB’s extra supervisory requirements regarding the LCR as laid out in its August 2023 executive circular, including those pertaining to 140-per-cent LCR compliance, tighter liquidity management and, in particular, the Pillar 2 liquidity buffer requirements, mainly related to deposit concentration, are still in effect. In the wake of this additional liquid asset requirement, necessitated by the extra outflow to be booked in relation to the risks of large deposits, demand for extra liquid assets in an amount of about HUF 1,200 billion had accumulated, thanks to 60 per cent of the individual banks, by 30 June 2025, equalling 8.5 per cent of the total Pillar 1 outflow, on an average. The requirement continued to impose a material burden primarily on smaller banks, but even certain large banks were forced to book extra outflows exceeding 10 per cent. With the Pillar 2 surplus requirement considered, the sector level LCR is, on the whole, 16 percentage points lower. However, as regards the LCR calculated with the Pillar 2 supplement, meeting 100 per cent is sufficient (Chart 15).
Chart 15: Sector-level LCR with the Pillar 2 requirement

Note: Calculated sectoral averages based on solo compliance. Source: MNB
The level and structure of liquidity may be affected by a variety of factors in the shorter, and in a longer term, no material decrease in significant liquidity surpluses is expected. The decision adopted by the MNB in July 2025 on reducing the mandatory reserve rate from 10 per cent to 8 per cent may continue to support the restructuring that determines the structure and level of liquid assets, though it may be regarded overall as an LCR-neutral one. The central bank’s long-term collateralised loans also began to mature in March 2025, whose impacts on liquidity and the LCR may be more negative depending on the extent to which the instant decrease in liquidity is offset by the conversion of assets released from collateral (primarily government securities) into liquid assets. Data showed that a few large banks had no or hardly any actually encumbered government securities left; therefore, the repayment of the MNB loans tended rather to reduce the LCR. In a longer run, on the other hand, the transfer of the deposits of municipal governments to MÁK (Hungarian State Treasury) accounts in several stages from October 2025 may bring about structural changes and a modest decrease in liquidity in the sector.
4.2. Banks have an adequate funding structure and stable funding
The EU-wide NSFR requirement for long-term stable funding is met by banks with significant, although marginally decreasing surpluses. The required 100 per cent was delivered by the banks in the past year in terms of individual compliance at a sector-level with a modest decrease, at 132 per cent according to data as of 30 June 2025, with a minimal decrease also in consolidated compliance. Accordingly, the sector-level stable funding surplus decreased by 6 per cent in one year to HUF 11,650 billion at end-June 2025, due to the growth in the demand for stable funding induced by an upswing in lending. The overwhelming majority of large banks had a way more than safe – 15 per cent in terms of individual compliance, or 29 per cent in terms of consolidated compliance – surplus of stable funding, significantly exceeding the minimum required levels (Chart 16).
Chart 16: Development of institutions’ NSFR

Note: Lower and upper deciles (dark blue lines), lower and upper quartiles (light blue bars), and median values (mean and median), based on solo compliance data. The NSFR came into force on 28 June 2021, up to that date estimated numbers (coloured area). Source: MNB
The modest decrease in the sector-level NSFR was a result of an increase in demand for stable funding in connection with asset side changes, stemming from an upswing in lending. The 2-per-cent increase in the sector’s demand for stable funding took place with an unchanged stock of net stable funds. The rate of the gross asset side growth determining the demand for stable funds also exceeded the rate of the gross liability side growth. The asset side was dominated by the increase in loans outstanding and in the stock of liquid assets generating low demand for stable funds. The dominant factors on the liability side included primarily household deposit and, secondarily, the increase in stable funding stemming from an increase in equity-type liabilities, exceeding the decrease in funds from financial customers by far. Overall, both the average risk weight of the facilities determining the demand for stable funding and the average stability factor of stable funds decreased by more or less equal rates during the 1-year examined period.
4.3. The domestic banking system is characterised by a significant liquidity and funding surplus even in international comparison
The position of the domestic banking system is considered good even relative to other EU Member States in terms of the two Basel type funding requirements, the LCR and the NSFR. As regards consolidated compliance: a comparison to the available EU data as at the end of the second quarter of 2025, clearly shows that both the domestic LCR (191 per cent) and the domestic NSFR level (147 per cent) for the same period are materially higher than the corresponding EU average ratios, and even higher than those of most of the Visegrád countries (Chart 17). The domestic banks’ loans to deposits ratio calculated by the EBA for non-financial enterprises and households as an average funding risk indicator (80.6 per cent) is way below the EU average (106.4 per cent), indicating a massive free lending capacity.
Chart 17: LCR and NSFR compliance of the domestic banking system in EU comparison

Note: Consolidated compliance, narrowed bank-based compliance except for Hungary, where data refer to the entire sector. In the case of PT, SI, CY, MT and LT, LCR averages above 250 percent are not shown for comparability. Data sorted by LCR levels. Source: EBA Risk Dashboard, MNB
5. Instruments mitigating external vulnerability (FFAR, FECR, IFR)
5.1. Systemic risk associated with external vulnerabilities of the banking system is moderate
The banking system’s systemic vulnerability associated with the short-term external debt continues to be historically moderate. The banking system’s short-term foreign debt denominated in euros had reached the year-2007 level by the end of second quarter of 2025. This, however, was through a small increase relative to the banking system’s balance sheet total or the GDP. According to preliminary figures the domestic banking system’s short-term debt – in terms of remaining maturity – amounted, at the end of second quarter of 2025, to EUR 9.9 billion, accounting for 5.0 per cent of the banking system’s balance sheet total, a little below the corresponding figure of the previous year. Although 2 percentage points over the all-time minimum, it is way below the maximum recorded in 2010 (Chart 18). The short-term external debt continues to be concentrated in the banking sector, and it is volatile in connection with certain less risky intra-group transactions of the few banking groups concerned.
Chart 18: Development of banking system short term debt

Note: SED – short-term external debt, GDP – gross domestic product, BST – balance sheet total, RES – international reserve. Credit institution sector, including MFB and KELER data. Historical minimum values, from first quarter of 1998. Source: MNB
5.2. The banking system meets domestic funding requirements with adequate buffers and a secure funding structure
The elements of the macroprudential toolkit targeting the external, foreign exchange and interbank financial risks of the banking system are met by the sector with safe buffers. Banks have a considerable manoeuvring room for lending and for the management of any funding shock in relation to the regulatory requirements applied domestically to complement the EU-level Basel liquidity funding requirements (LCR, NSFR) owing to country-specific risk characteristics (Chart 19). Significant buffers, proven to have been stable retrospectively in the short-term and the long-term as well, minimise the likelihood of funding problems akin to the challenges posed by the previous financial crisis.
Chart 19: Compliance of the banking sector with the liquidity and financing requirements
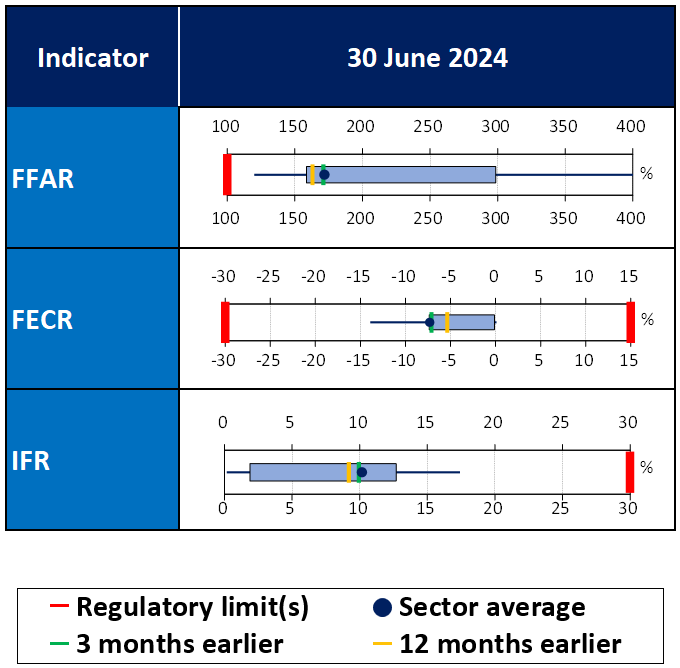
Note: FFAR - Foreign exchange Funding Adequacy Ratio, FECR - Foreign Exchange Coverage Ratio, IFR - Interbank Funding Ratio, MFAR - Mortgage Funding Adequacy Ratio, LCR - Liquidity Coverage Ratio, NSFR - Net Stable Funding Ratio. The edges of the blue rectangles indicate the lower and upper quartiles of the distribution, and the ends of the dark blue lines indicate the lower and upper deciles. For LCR, excluding mortgage banks and housing savings banks, based on solo compliance data. For NSFR, including mortgage banks and housing saving banks, based on solo compliance data. Source: MNB
The banking system is operating with significant foreign exchange surplus that is safe and of a favourable structure from the aspect of the Foreign exchange Funding Adequacy Ratio (FFAR) and the Foreign Exchange Coverage Ratio (FECR) rules. The sector-level FFAR was at a historic high during the past year as well, and at end-July 2025, it was up at 172 per cent with an approx. HUF 6,500 billion stable funding surplus. The foreign currency liability surplus to total assets ratio also stabilised, and at the end of July 2025, the FECR was at -7 per cent, conveniently in the acceptable from -30 to +15-per-cent range. At the end of the examined period, the banking system had a total amount of HUF 4,900 billion in the way of on-balance sheet foreign exchange funding surplus. The development of both the FFAR and the FECR is indicative of the banking system’s stable financing processes.
Despite quarterly fluctuations, fundamental stability is observable in the internal structure of increasing required stable foreign exchange funding considered in the calculation of the FFAR (foreign exchange assets to be funded) as well as the even more remarkably growing available stable foreign currency funds. The volume of customer deposits – in particular, the volume of corporate deposits placed by non-financial enterprises other than SMEs as well as the volume of short-term non-bank financial enterprises linked, for the most part, to investment funds, as well as their share of stable funds – increased on the liability side. The share of foreign exchange liabilities with a maturity over one year also increased moderately, in connection with the above changes. On the assets side there was a material increase in both the volume and the share of corporate foreign exchange guarantees and credit facilities, with a marginal impact on the FFAR due to the 0 or very small weights applied to the extent to which they are taken into account, i.e. they had no or hardly any impact on the demand for stable funds. (Chart 20).
Chart 20: Asset and liability groups requiring and ensuring stable financing, as well as development of financing ratios

Note: Based on unweighted items of the FFAR. Between March and September 2020 temporary tightening was in effect in case of FFAR and FECR. A: assets, L: liabilities. Source: MNB
In connection with the on-balance sheet open position, the banking system has an off-balance sheet FX swap market net forint fund raising exposure (Chart 21). The market, counterparty and liquidity system risks associated with swap market exposures are manageable. Although at a historic high in terms of volume, the FX swap market turnover (market size) is definitely low relative to the balance sheet total. The MNB’s FX swap facility continues to provide security on the forint-earning side.
Chart 21: Development of on-balance sheet FX and FX swap position aggregates

Note: A negative FX swap position covers a forint-gaining FX swap position. Source: MNB
The sector-wide reliance on riskier corporate funding remained stable at a low level, well below the 30-per-cent maximum permitted by the Interbank Funding Ratio (IFR) requirement. At the end of the second quarter of 2025, the sector-level average was the low level of 10 per cent, more or less unchanged year-on-year. (Chart 22). Most banks, including the large ones, comply with the requirement with significant buffers. Apart from one foreign-owned banking group relying exclusively on short-term funds as regards its interbank funds, larger branches continue to be operating with smaller free manoeuvring rooms, with the highest and most volatile ratios resulting from concentrated intra- and extra-group transactions. The share of funds of higher risk targeted by the IFR in corporate finance increased moderately, i.e. the share of exempted special funds with a lower risk decreased in the past year. On the other hand, the proportion of more volatile short-term exposures – including both those in forints, and those in FX – increased within the funds covered by the IFR, which was reflected in a smaller increase in the indicator due to higher weights. However, despite a small, unfavourable internal structural shift and also in view of the larger share of market finance, the reliance on funds from financial corporations does not show any significant increase in vulnerability due to the relatively low-level funds from financial corporations.
Chart 22: Development of the banking system's funds from financial corporations targeted by IFR
Note: Funds from gross unweighted financial corporations. Gross IFR is unweighted IFR-targeted financial corporation funds over all liabilities. Exempted funds: mortgage-backed funds, loans received from special institutions, funds from foreign branches of credit institutions, bonds with a maturity exceeding 2 years at the time of issue, balances of margin accounts, additional capital stock, funds received from credit institutions belonging to the group (not from the parent company), financial derivatives within the fair balance source side value. Source: MNB
6. Mortgage Funding Adequacy Ratio (MFAR)
6.1. The MFAR regulation is an effective tool for long-term, stable funding of banks and the development of the mortgage bond market
Together with the central bank’s mortgage bond purchase programmes the MFAR regulation has, during the past nearly ten years, contributed to the improvement of the banking system’s balance sheet maturity structure and, consequently, to the strengthening of financial stability, while it has also promoted the development of the domestic mortgage bond market. Instead of three, there are five specialised banks – mortgage banks – on the market issuing mortgage loans and providing refinancing services. The stock of mortgage bonds doubled – from the approx. HUF 1,000 billion recorded in 2015, it grew to HUF 2,345 by 30 June 2025 (Chart 23). As a result, the stock of mortgage bonds as a percentage of the total household sector mortgage loan stock doubled in the past decade, to 35 per cent at the end of second quarter 2025.
Chart 23: Development of mortgage bonds and mortgage bond/mortgage loan rate

Note: Mortgage bond stock projected to mortgage loans, calculated with the mortgage bond stock based on nominal value data, using an unweighted denominator and numerator. Source: MNB
The MFAR requirement is met by the banks and by the whole sector with significant buffers. The banking system’s MFAR average stood at 31.7 per cent on 30 June 2025 (Chart 24). On 31 March 2025, the ratio dropped to its 5-year low – at 28.5 per cent – because the banks typically delayed their new issues due to the uncertain conditions and the substantial existing surplus funds, in spite of the substantial maturing stocks and the increase in the existing mortgage loan stocks. However, overall, due to the long-term nature of this type of financing, it is a less volatile regulatory requirement, one that is highly predictable and depends primarily on the development of loan portfolios and the maturity of mortgage bonds (and related refinancing). This enables the mortgage bond issuances and refinancing relationships ensuring compliance to take place under the best possible conditions and at the most optimal time.
Chart 24: Development of MFAR compliance

Note: Mean, 10th and 90th percentile, 1st and 3rd quartile. Source: MNB
6.2. Some minor changes were observed in the characteristics of the mortgage bond portfolio, to a considerable extent was induced by the MFAR regulation
Over the past year, the total stock of mortgage bonds, including green and foreign currency mortgage bonds, has grown, which has also shifted the ownership distribution in a positive direction. Growth continued to be supported primarily by the MFAR regulation and the possibility of renewing mortgage bonds with the central bank. 12.5 per cent of the total stock was made up of green forint mortgage bonds, and in the wake of the second large non-green foreign currency mortgage bond issue, the stock of foreign currency mortgage bonds increased to 17 per cent. Every bank has green mortgage bonds now, while only one bank has issued foreign currency mortgage bonds. On the whole, the developments observed in recent years have contributed to both the diversification of mortgage bonds and keeping a wide range of investors interested in this particular form of investment (Chart 25).
Chart 25: Evolution of the stock of domestic mortgage bonds by currency and sustainability

Note: Based on data at nominal value. There are no green foreign currency mortgage bonds on the market for the time being. Source: MNB
As regards ownership structure, there is still considerable room for attracting stable funding actually from outside the sector, but the increase in the share of institutional and foreign market players outside the domestic banking sector is considered as a favourable development. On the assets side, banks continue to hold substantial mortgage bond portfolios. On the one hand, banking groups tend to hold considerable portfolios of own-issued securities, and on the other hand, banks’ mortgage bonds are also typically held on the assets side. As a consequence of the limited asset purchase programme – that has, for several years, been limited exclusively to the renewal of mortgage bonds, and that was not fully utilised on several occasions during the past year – the MNB’s share of ownership has halved since 2022. This decrease was less salient in the green mortgage bonds segment (Chart 26). In relation to the foreign currency mortgage bond issues, it should be noted that in line with the objective of the regulatory amendment enabling them to be taken into account in the MFAR calculation, the share of foreign ownership is increasing, with a significant and diversified composition of foreign banking and other financial intermediary investors not related to domestic banking groups.
Chart 26: Mortgage bond portfolios broken down by main ownership sectors

Note: Data at face value. Domestic institutional investors: other financial intermediaries, financial auxiliaries, insurance companies and pension funds. Other domestic investors: non-financial corporations, households and non-profit organisations serving households, general government subsectors. Source: MNB
The mortgage bond market is expected to grow even with regulations remaining unchanged. Years 2025 and 2026 will see the maturity of mortgage bond portfolios smaller than those that matured in previous years: HUF 269 billion in 2025 and HUF 98 billion in 2026. At the same time, in view of the upswing in mortgage lending and, in particular, the Home Start Programme, a significant expansion – of a hitherto unknown scale – of the mortgage loan portfolio is to be expected. This will generate substantial demand for bond issues: to keep up the current levels of MFAR compliance new mortgage bonds in a total amount of HUF 500–700 million may appear on the market in 2025 and 2026 according to conservative expectations – or even as much as HUF 900–1,300 billion if driven by more vigorous outflows –, depending on whether mortgage banks issue green mortgage bonds that can be taken into account in the MFAR calculation with a favourable weight, or they decide to issue brown securities instead (Chart 27). However, about half of these, or even less may be sufficient for meeting the 25-per-cent MFAR minimum as required by the regulator, but in a distribution between other banks, on account of the different MFAR surpluses.
Chart 27: 2025-2026 issuance needs with different JMM compliance targets and mortgage bond types under different loan growth assumptions

Note: Estimate based on MFAR data as of June 30, 2025. Taking into account the projected growth of loan portfolios in the MFAR denominator for the second half of 2025 and the entire 2026, including the impact of the Home Start loan program. In terms of the issuance requirement, we also took into account the adjustment needs of other banks through refinancing relationships. Source: MNB
6.3. A revision of the MFAR regulation became necessary partly in view of mortgage lending processes
7. Capital buffer of systemically important institutions (OSII-B)
The MNB's annual periodic review for 2025 classified the same seven banks as in previous years to be Other Systemically Important Institutions (O-SIIs). The relatively modest change in the systemic importance and concentration of O-SII banks in the past year did not justify any change in buffer rates.
As a result of the identification process in 2024, the same seven groups of banks as last year had been classified as other systemically important credit institutions for 2025 as well. During the latest regular identification of Other Systemically Important Institutions (O-SIIs) headquartered in Hungary in 2024, the MNB continued to use the same measurement of systemic importance as in previous years, based on the aggregation of the EU-harmonised core indicators and the added optional domestic indicators. Using the audited data as of 31 December 2023, the MNB thus reviewed the O-SII scores representing systemic importance, which, as in previous years, exceeded the 275-basis-point threshold for systemic importance classification for seven banking groups (Chart 28).
Chart 28: Components of the scores of other systemically important institutions and their final buffer rates

Note: The scores shown are the results of the 2024 review. The horizontal blue line indicates the standard 350 basis points in the EBA Guidelines, while the red line indicates the domestic threshold level above which a bank is identified as O-SII, reduced to 275 basis points in 2020 as permitted by the EBA Guidelines. Source: MNB
The systemic risk footprint of the entirety of the O-SII banks stabilised at a high level, its previous growth stopped according to the 2025 scores. The total market concentration of the significant banks remained essentially unchanged in comparison to the previous year’s total score (8,025 basis points in aggregate, down by 62 basis points from the score of the previous period). As in previous years, the distribution of scores measuring systemic importance does not show a significant shift and has proved to be stable (Chart 29). The rapid growth of the OTP group had a significant impact on the components of the scores by the change in the indicators representing real economic relations, while the size, and the lending or deposit collection activities of the other O-SII banks increased only modestly, or stagnated. In addition to the slower expansion of the domestic market, the international expansion of the OTP group also expanded several components of the bank’s O-SII score, the impact of the acquisitions completed in 2023, and the outstanding growth achieved in certain other foreign markets, on the size of the group significantly outweighed effects in the opposite direction at other foreign markets where the group has presence (such as the sale of Banca Transilvania, which has already appeared in the year-end 2023 data). The evolution of the more volatile financial market and interbank indicators often only temporarily causes minor shifts in the scores. Conversely, the international expansion of the OTP group induced further structural transformation and made the group’s dominance even stronger in these indicators. The significant transformation in the network indicators of financial connectivity was the further decrease in the activity of various interbank market segments that characterized the banking system as a whole in 2023. While the volume of transactions between O-SII banks was significantly lower than in previous years, the largest branches participating in the interbank market maintained their more extensive intermediary role and increased their importance in the related sub-indicator. In the swap market network – which is also considered critical at the systemic level – the forint-side transaction volume of certain O-SII banks typically expanded significantly, either through financial relationships within or outside the international group.
At the end of 2025 Q2, banks needed HUF 675 billion in capital to meet the O-SII buffer requirement; however, they operated with a hefty free capital buffer of nearly HUF 2,218 billion, and even the lowest excess capital buffer ratio reached 4.5 per cent with significant individual differences in the capital headroom of the O-SIIs.
Chart 29: Changes in the scores of other systemically important banks

Note: The years indicate the validity period of the scores, the scores are calculated by the MNB on the basis of the audited data provided as of 31 December of the antepenultimate year. Source: MNB
BOX III: A comparative analysis of buffer rate assignment rules of the EEA Member States (“bucketing”)
The cross-country comparative analysis indicates that the calibration of the domestic O-SII buffers is balanced not only in relation to the prescribed buffer rates, but also in comparison to the buffer rate allocation rules. The required O-SII buffers show a relatively large variation between EU Member States. The significantly different regulatory risk tolerances possible between Member State calibrations have been examined on multiple occasions; for example, the EBA (2020) carried out a comprehensive assessment of the relationship between O-SII scores, serving as the primary guidance for calibration, and the O-SII buffer rates. Most recently the ECB (2025a) analysed the O-SII scores from the perspective of the Banking Union, calculating the market share-based components of the scores as a proportion of the entire Banking Union banking system instead of using the usual member state aggregates, from which it concluded that the buffer rates of the Banking Union’s O-SII credit institutions show substantial heterogeneity. In addition to the buffer rate floor assignment rule based on the scores calculated on the basis of member state banking system aggregates, which is already in effect and applicable in the Banking Union, another one will also be fully introduced by 2028, to reduce this heterogeneity. The new rule will establish minimum values (floors) for buffer rates in the Member States based on scores calculated on the basis of shares relative to the entirety of the Bank Union’s banking system instead of the Member States’ banking systems (see ECB, 2025b). From the domestic perspective, the calibration applied by the MNB was compared to those of the EEA member states by the MNB’s 2023 Macroprudential Report, demonstrating – on the basis of the joint distribution of scores and buffer rates – that the domestic buffer rates fall in the middle of the international range.
With the purpose of render the different Member State assignment rules pairwise comparable across any given range of scores, the different designs of bucketing-based assignment rules between O-SII scores and buffer rates are summarised in a single metric for each Member State, in pairs. Instead of the buffer rates specified by the macroprudential authorities, in the following paragraphs, we are going to compare those bucketing rules for buffer rate assignment that are applied by a majority of the Member States (19 authorities at present) and accessible to the public. These have been parameterized differently in the various countries, but according to the commonality in their design they all assign monotonously increasing buffer rates to the successive ranges of the scores (so-called “buckets”). Chart 1 shows such a bucketing assignment rule, more specifically the ECB buffer rate floor system used as an example. The design of the buckets typically includes a 0-per-cent buffer rate bucket, which is assigned to the score range with the lowest degrees of systemic importance (below the yellow area in the chart). This is generally followed by a segment in which the buffer rate increases step by step, where the number and sizes of buckets and the rate of the increase of the buffer rates are, for instance, designed in a country-specific way (covering the light green areas in the chart). Finally, a top bucket which contains the handful of O-SII banks, or which is completely empty, is associated with the highest buffer rate applied in the given Member State, which may in certain cases be lower than the statutory 3-per-cent minimum imposed by the CRD. In order to make the relatively large number of cross-country comparisons manageable and perspicuous, the unique structure of each bucketing design is summarised in a single metric that characterises the implied policy strictness. For this purpose the size of the area covered by the buckets is calculated, which covers a part of the plane delimited by the theoretical maximum of the score (10,000 basis points) and the buffer rates’ standard statutory maximum (3 per cent), and which can also narrowed down further to its most relevant sections populated by the O-SII banks (the areas referred to, below and above the step function-like assignment, are illustrated by colouring in Chart 1). To illustrate the working of the proposed metric of area covered with some examples, if in an extreme situation, any bank independent of its score were to be assigned the maximum 3-per-cent rate regardless of its score, then 100 per cent of the area would be covered, alternatively if they were assigned a flat 1.5-per-cent rate, the covered area would shrink to 50 per cent, finally if below 5,000 basis points banks were assigned a 1.5-per-cent rate and above 5,000 basis points they were assigned a 3-per-cent rate, then 75 per cent of the area would be covered (so the final example would be a 2-bucket structure where there is no one zero bucket up to the 350-basis point or any other threshold).
Chart 1: Illustration of a bucketing-based buffer rate assignment rule and the area covered (green) by the buffer rates, using the buffer rate floors of the ECB

Note: The O-SII banks identified in the EEA countries are shown in the chart with point markers. The ECB methodology illustrated is the version in place from 2024 January 1, see ECB (2022). Source: MNB, ECB and ESRB notifications
The analysis of the proposed metric indicates that the bucketing-based assignment rules vary widely by design, and not just with respect to the resulting buffer rates, while the domestic calibration used by the MNB is regarded proportional in this comparison too, as it lies between the most conservative or the least strict bucketing systems. The results of the comparison are summed up in Chart 2, in which the coverages ensured by the various Member State assignments can be compared across Member States. To provide a compact presentation of the calculations in the chart, the same value of the area covered by some reference assignment rule, specified below, is subtracted from the country-specific area covered by the bucketing system of each Member State. One of the selected reference set of rules is the floor system for O-SII buffer rates determined by the ECB (2022) i.e. the columns pertaining to this in the chart show for each Member State how much larger the area covered by the bucketing designed by the Member State’s authority is than the ECB minimums. While certain bucketing designs ensure even larger than 20-per-cent coverages, other Member States – applying the ECB minimum floors – do not deviate from the reference system in terms of coverage. Another reference design used in the chart shows the difference between the coverage of each of the various Member State’s bucketing calibration and the area covered by a monotonously increasing step function. The estimated piecewise constant function is similar to bucketing rules as it returns monotone increasing constant values for each consecutive segment. It was fitted on the sample of the scores and buffer rates reported by the EEA O-SII banks between 2020 and 2024.3 Analysing the results, both the material variance is observable, and that the domestic calibration falls in the middle of the range under this approach too. The MNB does not publish bucket ranges; however, a conservative, risk averse limiting approximation of bucketing has been selected from among the possible bucketing-based assignment rules that could be fitted the scores of domestic O-SIIs and their corresponding buffer rates.4 Finally, a considerable variability is detectable in the difference between the bucketing-based buffer rate assignments of various Member States and the hypothetical buffer rate assignment rules that use a linear, continuous, monotone increasing function over the interval of scores where the bucketing step increments are applied up to the starting point of the largest bucket. This difference may imply that the steps of bucketing increase faster (positive difference) or slower (negative difference) relative to linear assignment, so it may be conceptualized as an indication of the degree of convexity of the bucketing, think for instance about the convexity of a suitable continuous, piecewise linear approximation fitted on the starting points of the intervals of the buckets.
Chart 2: The differences between the policy area covered by the bucketing-based assignment rules for buffer rates used by the Member States, the estimated reference assignment system and the linear assignments

Note: On the left-hand-side scale of the chart, the differences between the policy area covered is expressed as a ratio of the total area. Data for Member States is based on the collection of the EBA with 2024 as a reference year, except for HU in which case 2025 is the reference year. [350; 1500], [1500; 3000] and [3000; 5000] indicate those intervals over which the differences have been calculated, expressed in basis points. F_1 and F_2 indicate the two, parallelly applied, differently calibrated bucketing by the Finnish authorities. Source: MNB
The overall conclusion is that the calibration of the capital buffers for domestic systemically important financial institutions is assessed as balanced in international comparison across the EU, the Hungarian regulation is neither on the most conservative, nor on the least strict end of the spectrum.
8. Systemic Risk Buffer (SyRB)
8.1. No capital requirement needed to be imposed on any bank based on the SyRB calibration in effect up to September 2025
8.3. Several EEA countries apply sectoral systemic risk buffers focused on the real estate market
9. The MNB’s resolution activity
9.1. The MNB closely monitors compliance with the full MREL requirement prescribed by the MNB with effect since 1 January 2024. The requirement is continuously met by the institutions concerned
The institutions have, since 1 January 2024, been complying with the mandatory MREL requirements imposed by the MNB. The institutions concerned have, since 1 January 2024, been operating in full compliance with the MREL requirements prescribed by the MNB in resolution planning. The requirements specified as a ratio of the total risk weighted asset value – without buffer requirements – were in the 18.9–28.6-per-cent range at end-2024.
There has been a moderate shift at the institutions concerned from equity-type MREL-eligible resources towards MREL-eligible bonds. The pricing of the liabilities underlying MREL compliance was largely determined by their seniority: equity-type liabilities were more expensive while non-priority uncollateralised bonds, as well as senior bonds and parent bank liabilities were less expensive. Accordingly, and because the raising of the capital buffers reduced the MREL-eligible capital resources, the proportion of equity-type MREL-eligible liabilities dropped by some 5–6 percentage points, while the portfolio of external MREL-eligible bonds increased by just as much. Nonetheless, compliance continues to be achieved primarily through MREL-eligible capital (Chart 31)
Chart 31: MREL capacity’s distribution for large banks

Note: The external MREL applies to the resolution entity, typically a banking group. The group meets this requirement with the help of liabilities withdrawn from the market, which can be written off or transformed. The internal MREL requirement pertains to subsidiaries of a group, which are not separate resolution entities. These subsidiaries also have to ensure that there is sufficient available loss absorbing capacity within the group, which they typically do by way of intra-group liabilities, such as loans provided by their parent company. Source: MNB
Banks repurchased the bulk of the HUF 275 billion worth of external MREL-eligible liabilities turning into shorter-than-1-year liabilities in 2024. MREL-eligible liabilities must have longer than one-year remaining maturity; therefore, MREL-eligible liabilities whose remaining maturity becomes shorter than one year (non-priority uncollateralised bonds and senior bonds) turn into relatively expensive liabilities that no longer support compliance with the MREL requirement; accordingly, buying them back is a justified funding cost reducing practice from the banks’ perspective.
The remaining maturity of 31 per cent of the external MREL-eligible liabilities, i.e. HUF 702 billion, turns shorter than one year in 2025, ceteris paribus. In 2025 H1, we found that for this reason the repurchase of the liabilities losing their MREL-eligibility continued, while the new issuances consisted of T2 bonds and non-priority uncollateralised bonds. The new issues are successful; they are massively oversubscribed. (Chart 32) The need for renewal is reduced by the fact that surplus MREL-eligible liabilities in an amount of HUF 2,063 billion were held by bank at end-2024.
Chart 32: Expiry of external MREL eligible liabilities

Source: MNB
The MNB closely monitors the volume and concentration of MREL-eligible bonds sold to households and may introduce restrictions in this market, if necessary. In line with European practices, the sale of MREL-eligible bonds to the general public has also been gaining ground in Hungary. Excessive transfer of bank failure risk to the general public may jeopardise financial stability. In the event of a change in European regulations, or on the basis of a decision of the Financial Stability Council, the MNB may, in the document “The MNB’s principles for setting minimum requirement for own funds and eligible liabilities (MREL)” limit this type of excessive household investments, if necessitated by their volume or concentration.
8.2. Resolvability assessments will be focused on testing the implementation of resolution plans, while resolution plans will seek to develop alternative resolution tools in the future
BOX IV: Measures supporting the efficiency of the Emergency Liquidity Assistance process
10. The MNB’s financial consumer protection activities
10.1. The number of credit institution clients requesting MNB action decreased in 2024
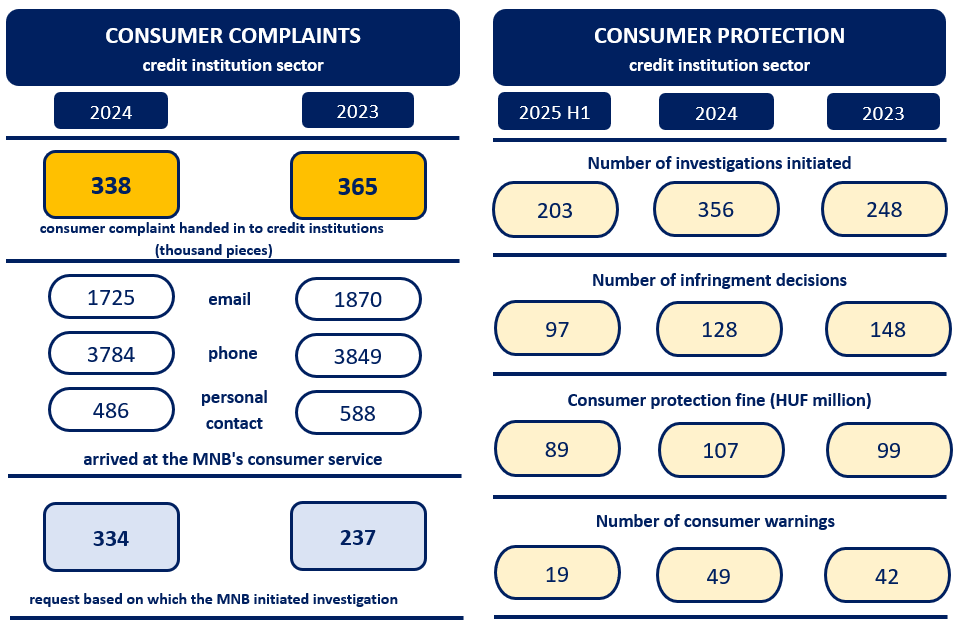
The number of complaints landing with the credit institution sector continued to diminish in 2024 year-on-year, as it did in earlier years. The most common topics of complaints received by credit institutions in 2024, in descending order: financial abuse, settlement disputes, and the execution of orders; however, the number of complaints relating to financial abuse decreased relative to the previous year, accounting for 23.3 per cent of all complaints in 2024. The number of consumer requests received by the MNB grew considerably – by more than 40 per cent – in 2024, exceeding the increase of 10 per cent observed in 2023 (Chart 33). Most consumers filed complaints regarding institutions’ complaint management practices or their administrative procedures relating to online or telephone fraud. While the number of investigations initiated by the MNB increased, the proportion of decisions establishing violations of the law decreased (already below 50 per cent in 2025 H1). The consumer protection warnings issued as part of continuous supervision, enabling quick action, related in most cases to deficiencies in the information published by the institutions in 2024.
Chart 33: Consumer complaints and consumer protection activities in the credit institution sector
Source: MNB
10.2. Shortcomings have been identified in the information provided by the institutions before the termination of mortgage loan contracts affected by delays in payment
10.3. There has been a considerable increase in payment service abuse in the recent period
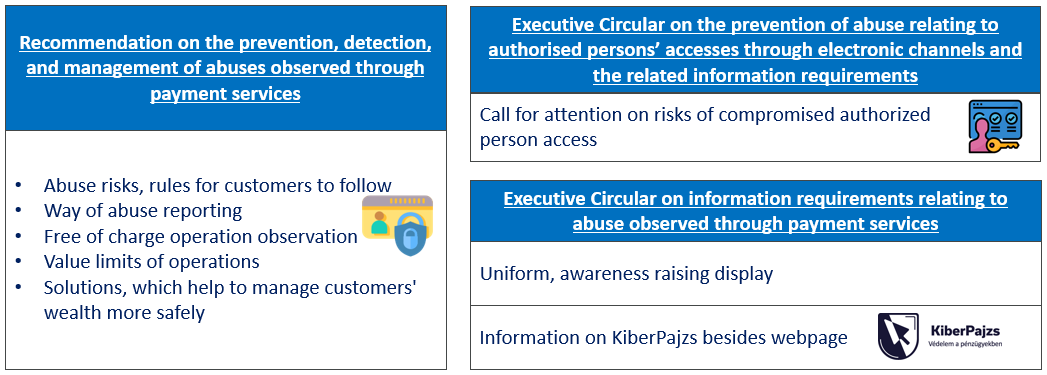
Payment service abuse has evolved into a major risk in recent years, with a wide range of customers falling victim to phishing and telephone calls made on behalf of banks with the aim of accessing customers’ money. Raising financial awareness among customers and strengthening their self-defence is becoming more and more important in the face of the dramatic growth in the number of such incidents (see Chapter 11); therefore, the MNB plays a predominant role in the cooperative effort called KiberPajzs (CyberShield) (Protection against online fraudsters | KiberPajzs).
The MNB is making particular efforts towards the prevention of financial abuse, as part of its duties as an authority; as such, it has issued a number of guidelines during the recent period to provide customers with adequate information and it checks institutions’ compliance with their duties in the scope of its supervisory activities. In 2024, the MNB examined, under its continuous supervisory activity, with a risk-focused approach, how banks fulfil the requirements laid down in its Recommendation No. 5/2023 (VI.23.) on the prevention, detection, and management of abuses observed through payment services regarding the provision of information (Recommendation), and how they carry out the instructions contained in the two executive circulars issued regarding the prevention of payment service abuse (Chart 34).
Chart 34: The main elements of the requirements issued by the MNB concerning the provision of information in relation to payment service abuse
Source: MNB
In the course of the backtesting of compliance with the Executive Circular on information requirements relating to abuse observed through payment services the MNB identified – inter alia – shortcomings in the presentation of the links pointing to credit institutions’ sub-pages showing information regarding the prevention, detection and stopping of abuse, the placement of the related logos, the structural design and content of the sub-pages, information sent directly to consumers, the contents of advertisements and the information provided regarding possibilities for suspending or blocking internet bank and mobile bank channels. In the course of the verification of compliance with the requirements stipulated in the Recommendation the MNB also identified some minor shortcomings in relation to the information provided regarding the possibilities of monitoring instant transactions and transaction limits, as well as possible solutions available for the management of customers’ assets with increased security. Moreover, the MNB drew banks’ attention to their obligation to comply with the instructions contained in the Executive Circular on the prevention of abuse relating to authorised persons’ accesses through electronic channels and the related information requirements, whenever it was necessary. In the wake of the reminders the banks took the necessary actions to ensure that they comply with the requirements regarding the provision of information with the aim of preventing payment service abuse (as specified in the Recommendation and the two circulars referred to above).
BOX V: The potential risks related to deferred payment schemes and possibilities for managing such risks
11. Financial stability risks of climate risk and options for their macroprudential management
11.1. The MNB closely monitors the financial systemic risks of climate change
The volume of sectoral credit exposures in the banking system’s corporate loan portfolio that are vulnerable to transition risks expanded or stagnated in most of the industries concerned, while in construction it decreased considerably. The credit financing by banking groups of the so-called climate policy relevant sectors (CPRS,10 see: Alessi and Battiston, 2022) – as per the definition used recurrently by risk monitoring systems – remained during the past year at a high level relative to the total corporate loan portfolio (Chart 35). The ratio of CPRS exposures to the banking system’s total corporate loan portfolio dropped to just under 62 per cent by the end of 2025 H1. This, however, was not due to a favourable restructuring of the portfolio resulting from an expansion in green loans, but rather to a significant decline in both green and non-green loan financing in the construction industry. Based on the share of CPRS exposures and the GHG intensity of the funded activities, substantial differences are observed between the portfolio compositions of credit institutions. The Banking System Climate Risk Matrix of the MNB Green Financial Report (on the methodology see: Ritter, 2022) evaluates the portfolios’ risks at an institutional level, factoring in the corporate loan and securities exposures as well. The updated data of the Matrix – covering 2025 Q2 – show a decrease in the risks, with only one domestic systemically important bank being assigned to a relatively higher risk category (the so-called middle-upper quarter in the Matrix), while the other six systemically important banks are assigned to a lower risk category (the so-called middle bottom quarter). For the evaluation of long-term trends, it is also worth watching the MNB’s other regularly updated climate risk measuring tool, the Bank Carbon Risk Index (BCRI) appearing in the MNB’s Green Financial Report. The index shows that an increase in the transition-related climate risks was observed in the domestic corporate loan portfolio during 2022 and 2023. Thereafter the climate risks stagnated at that level (on the methodology see: Bokor, 2021). For a more accurate risk description the BCRI is adjusted with the green corporate loans that are regarded as risk-free, whose domestic portfolio exceeded HUF 780 billion at the end of 2025 Q2, and with the individual GHG emissions of the companies participating in the European Emissions Trading System (ETS) (Ritter, 2023).
Chart 35: The evolution of exposures to climate policy relevant sectors (CPRS)

Note: The graph shows end of the year loan exposures (outstanding principal debt) in case it is not specified further. See Alessi and Battiston (2022), Battiston et al. (2022) and Battiston et al. (2017) for the classification of NACE economic activities into CPRS sectors, however, for 2025 the MNB applies its own adjustments to the classification due to the NACE 2.1 revision, as the correspondence between industries and CPRS sectors has been defined earlier in the literature and the new NACE industry definitions have to be reassigned in some cases. The green loan part of the exposure to the CPRS sectors includes i) the EU green taxonomy aligned exposure as they are provided in the credit register data reporting, ii) the green corporate loans of the preferential capital requirements programme, iii) green loans provided under the Gábor Baross Reindustrialization Loan Programme iv) the green investment loans provided under the Demján Sándor Programme and v) loans benefiting from the CRR Art. 501.a infrastructure supporting factor. Green loans financing fossil fuel, energy intensive, transport and agriculture CPRS sectors are not shown on the graph as their sum is around HUF 40 billion, an order of magnitude which is yet too small compared to the scale of the graph. Source: MNB
11.2. The MNB supports the achievement of climate change targets through green differentiation of borrower-based measures within its macroprudential policy as well
Since 2021, no significant improvement in the energy efficiency of mortgage-financed properties is visible, with the exception of properties financed under the Green Home Programme (GHP). The share of better-than-modern collateral in new residential mortgage lending has been low and stable since 2021 (rated BB or better under the ratings in effect until October 2023 and A or better under the ratings currently in effect), ranging from 20 to 30 per cent, while during the past year the share of housing loans financing energy-efficient, modern real estates within new loans decreased for a while and then stabilised at 20 per cent. The decrease was due to a correction following a drop in the housing loans for purchase of used homes during the past years. The low proportion of green real estates within new lending was only improved for a while by the funding period of the Green Home Programme, when the share of green housing loans exceeded 50 per cent (Chart 36). On the whole, however, there continues to be ample room for strengthening the contribution of mortgage lending to the improvement of energy efficiency.
Chart 36: The distribution of housing loan disbursement by the energy performance of the funded properties

Note: Taking into account the new energy classifications of November 2023. The missing data is explained by potentially missing Energy Performance Certificate during the home purchase, as well as data quality reasons. *We also considered construction and new home purchase mortgages contracted from 1 January 2025 as green. The MNB continuously strives to minimize the proportion of missing data. The proportion of modern, better, green properties is by volume within the available data. Source: MNB
In view of the potentially lower credit risk of green real estates, in order to boost their bank financing and thereby to support the improvement of the energy efficiency of domestic real estates the MNB decided to apply more favourable DSTI and LTV limits to loans meeting the green criteria, from 1 January 2025. Under the new rules, the LTV limit will increase to 90 per cent for forint mortgage loans that meet the conditions for green collateral and loan purposes set under the Green Preferential Capital Requirement Programme and have fixed interest rates for at least ten years (regardless of whether the borrower is a first-time home buyer or not). In parallel, for qualifying loans, the applicable DSTI limit increased to 60 per cent regardless of the income of the customer.
The year-on-year decrease in the share of green housing loans could be offset by the more favourable LTV limit applying to green collateral and loan purposes. The proportion of green housing loans decreased in general in comparison to the preceding years, irrespective of income burden. However, it is still true that the share of green housing loans increases in parallel with the increase in the DSTI, due to the high repayment instalments stemming from the high real estate price and loan amount. In connection with the collateral encumbrance, the only category in which the portfolio of green housing loans did not materially decrease year-on-year in 2025 H1 was that of housing loans provided with low – 10–20-per-cent – down payment, or 80–90-per-cent LTV (back in 2024 still only available for first-time home buyers), while it decreased by 5–10 percentage points in all other LTV categories. At the same time, in 2025, the share of green housing loans was about 8 percentage points higher among the loans provided with 80–90-per-cent LTV than among those with 70–80-per-cent LTV. This may be explained by the higher green LTV limits that came into effect from the beginning of 2025. The strong negative relationship between the LTV exposure and the ratio of green loans seems to be easing as a result of these processes (Chart 37).
Chart 37: The share of energy efficient properties by DSTI and LTV stretch

Note: By volume. Only construction and purchase loans. Taking into account the new energy ratings from November 2023. We also considered construction and new home purchase mortgages contracted from January 1, 2025 as green. Source: MNB
The green modification of borrower-based measures that entered into force on 1 January 2025 could provide targeted support for the growth of green lending without increasing the risks. The proportion of green housing loans making use of the higher 80–90-per-cent LTV manoeuvring room (green LTV limit) is approx. 2 per cent, of which 0.4 percentage point is green housing loans granted to non-first-time home buyers. In this way, borrowers utilised the green LTV limit in the case of about 7.5 per cent of the potentially eligible green housing loans. Non-first-time home buyer borrowers taking out green housing loans and utilising the green LTV limit had a higher-than-average income – about HUF 1.45 million per month – taken into account in the calculation of the DSTI. In this way, the risks associated with these loans may be materially lower on account of the lower probability of non-performance due to the higher incomes and on account of the potentially higher stability of the value of the real estates.
Chart 38: The volume distribution (left panel) and average income (right panel) of new housing loan disbursement by green collateral and FTB status

Note: FTB – First-time buyer. 2025 data is based on the first half of the year. Only construction and house purchase loan purposes. Source: MNB
12. The systemic significance of cyber risks and the potential risk management options
The intensification of cyber risks arising from vulnerabilities in information systems, data and networks (e.g. hacker attack, data loss, service failure) have emerged as a trend with the progress of the digitalisation of financial intermediation. Cyber Incidents have been occurring more and more frequently: according to an EBA (2025) survey the number of successful cyber-attacks with a significant impacts among larger EU banking groups rose to a new high in 2024 and early 2025 as well, and various comprehensive CRO surveys11 conducted with the involvement banks’ risk officers list cyber risks among the most important types of risks to deal with. The presence of geopolitical tensions contributes significantly to the intensity of cyber threats. For example, the ENISA (2025) categorised nearly 87 per cent of the incidents it had collected between 2024 Q2 and 2025 Q2, in which EU entities were attacked, as ideologically motivated attacks or ones perpetrated with state involvement. Digitalisation and the spreading of instant payment systems have extended the attack surface in the financial system as well. Increasingly sophisticated techniques of fraud, phishing campaigns and other forms of abuse appear, based on artificial intelligence which is now becoming more and more easily accessible and applicable. Some of the larger institutions and customers of the domestic banking system have also been attacked during the past year. They were the target of, for instance, denial of service and phishing incidents. While domestically the frequency of certain types of frauds successfully committed and detected in electronic payment transactions decreased, the total number of cases of all of the various types increased during the period concerned (Chart 39).
Chart 39: Payment frauds related to electronic payments of domestic payment servicers

Source: MNB
Cyber risks are among the new, complex threats to financial stability, whose impacts may affect not only the operations of specific institutions but potentially the entire financial system. While the potential of cyberattacks is, presumably, up to a systemically critical level where they are capable of threatening financial stability, owing to the limited availability of historical experience and the diversity of the attackers, the technologies used in the attacks, the potential disruptions and failures caused (various breaches of confidentiality, data integrity and availability), as well as that of the costs to be borne by service providers and customers, the likely impacts of the conceivable stress processes can in some cases only be estimated with a considerable degree of uncertainty. The resilience of the system is also affected by factors such as the substitutability of the services lost or the risk correlation and interconnection between the financial and the IT service providers. Such attacks can cause both direct financial costs as well as extensive stress, for instance, through the loss of customer confidence which may even lead to the disruption of payment chains and system-level liquidity problems. For this reason, the maintenance of cyber resilience is now an essential prerequisite for the upkeep of financial stability.
Authorities need to adopt regulatory responses in preparation for such risks. The resilience of the banking system, on the one hand, can be strengthened against operational risks arising from cyber incidents: its strategic directions include preparing IT systems for quickly detecting and defending against attacks, revising risk management capabilities based on the results of cyber defence tests, developing databases on cyberattacks, sharing experiences and strengthening international cooperation. On the other hand, progress in detecting second-round financial impacts may be made in the short-term through the development of liquidity monitoring and of specialised stress tests, while in the long-term the possible solutions may include the fine tuning of prudential regulations on liquidity and loss absorbing capacities, or the clarification of the deposit insurance rules with respect to the management of losses suffered by depositors as a consequence of cyber incidents (ESRB, 2023).
The purpose of macroprudential stress tests of cyber risk scenarios is to explore system-level impacts on the financial system that may be induced by severe cyber incidents. Bottom-up stress tests probing operative risks are the primary analytical tool of examining cyber resilience, evaluating the technological and organisational preparedness of individual institutions(see, for instance, DFSA, 2024; BoE, 2025; ESRB, 2024). However, microprudential examinations (institutional-level compliance) alone do not fully cover systemic and secondary mechanisms. Therefore, the implementation of macroprudential monitoring and the combination of top-down and bottom-up approaches may be required. This may involve, on the one hand, the strengthening of a systemic approach in the testing of operational-technological processes; for instance, the impact of cyber incidents may appear simultaneously or spread because of third party ICT service providers and infrastructures. The financial network map that is already in use as a macroprudential monitoring tool can be supplemented by the network representation of the technological relationships facilitating the description of operational contagions (cyber mapping, illustrated in Chart 40). This could also cover critical third-party ICT providers in the technology supply chain and central institutions of the financial infrastructure (e.g. VIBER, GIRO, KELER) and enable the mapping of technological disruptions spreading through IT channels which could potentially be used in the development of stress scenarios and testing (on possible central bank applications see, for instance, Banka Slovenije, 2024). The mapping of the domestic critical service providers and dependencies may be supported by the register of service providers which is currently being developed. On the other hand, financial risk channels may be activated as a second-round effect of the disruption starting out as a local operational problem and the shock may escalate into a system-level liquidity, financial market and confidence crisis. It is worth exploring, from a regulatory perspective, whether financial stress tests can be applied or adapted with appropriate scenarios to analyse potential indirect liquidity and confidence effects of cyber incidents, and whether they can be incorporated into the traditional system risk modelling toolkit.12
Chart 40: Schematic presentation of a cyber map

Note: The abbreviations in the chart have the following meaning: CB: central bank, CCP: central clearing counterparty (e.g. KELER), Cloud: cloud service (provider), FC: financial corporation, Hardware: critical hardware device or hardware provider, ICT SP: information and communication technology service provider, RTGS: real-time gross settlement system (e.g. VIBER), Software: critical software tool or software provider. Source: MNB, based on Banka Slovenije (2024)
Digital resilience testing will have to be conducted regularly under the Union’s Digital Operational Resilience Regulation (DORA) by way of threat-based penetration testing of all ICT systems that support critical or important functions. Of the testing options for critical systems mention should be made, from a macroprudential perspective, of the technique called threat led penetration testing (TLPT) in particular. After the preparation period these will have to be carried out once every three years. Critical functions, and all internal or outsourced ICT systems, processes, technologies and services supporting them, will have to be identified. TLPT mimics the tactics, techniques and processes of entities constituting actual threats, which are regarded as the sources of cyber threats, and carries out the controlled, customised and intelligence-based testing of the financial organisation’s critical live systems. Together with the aforementioned liquidity stress tests these IT security tests may support the assessment of the level of operational and financial cyber resilience as well as the determination of any necessary supervisory or regulatory measures. Several other important aspects of DORA may also support macroprudential monitoring and the development of stress tests in the future. Its reporting and testing requirements will facilitate the collection of comparable and reliable information on cyber incidents, on defence capabilities, and on critical ICT third-party service providers. Such information is currently fragmented and may be distorted. The Regulation also provides a legal and regulatory background for supervisory actions.
The MNB’s “five strikes” initiative supports financial stability, besides its other objectives, through enhancing cyber resilience. The main measures of the policy package – e.g. extend the liability of banks, the conduct of targeted investigations and the encouragement of technological development – also fit well in the financial stability goals. Risk of confidence and liquidity shocks could be reduced even in a short-term with some of the key elements of the MNB’s initiative as banks are expected to be more active in protection against fraud and in taking responsibility for prevention. The MNB’s targeted inspections and the strengthening of its monitoring functions may provide a good information basis for prospective liquidity stress tests factoring in cyber risks as well.
BOX VI: The banking system’s preparedness for extreme events and the associated potential prudential requirements
1 In our calculations, the following eight indicators were found to have the strongest crisis prediction capabilities: the household additional credit-to-GDP gap; the balance sheet total-proportionate total risk exposure amount; the system-level LCR; the balance sheet total-proportionate exposure to general government; the year-on-year change of the GDP-proportionate government debt; the MNB’s house price margin indicator; and the proportion of households’ investments in risky financial instruments.
2 Financial Stability Report (May 2025)
3 The following estimate was taken into account for the alignment of the piecewise constant function:  , where y = (y1, … , yn) are the observed buffer rates whose sequence corresponds to the sequence formed in accordance with the arrangement in a sequence of the matching O-SII scores, (si , yi), i ∈ {1, … , n - 1}, s1 ≤ … ≤ sn and provided that 1) buffer rate is monotonously increasing, i.e. (βi+1 – βi) ≥ 0, i ∈ {1, … , n - 1}; 2) the buffer rate increment is an integer multiple of a minimum m = 0.25 increment, in other words (βi+1 – βi) = kim, i ∈ {1, … , n - 1}, 0 < ki < Kmax ; 3) 3) the buffer rate value is zero below 350 basis points, i.e. βj = 0, j ∈ {j ∈ {1, … , n}: sj ≤ 350bp} ; 4) and finally, the buffer rate falls in the range allowed by the statutory minimum and maximum values, i.e. βmin ≤ βi ≤ βmax, i ∈ {1, … , n} . With the second term of the objective function, similar to fused lasso regression estimates (see Tibshirani et al., 2005), it is possible to penalise frequent, small-increment steps, depending on the parameterisation of the wi (α, Di+1) , where the weights are a decreasing function of Di+1:= | βi+1 - βi |. The selection of the parameter range for the β estimates, i.e. for the estimated buffer rates, was guided by the conditions that the shape of the bucketing should not change materially due to changing parametrization on the selected range, and the number of buckets should be similar to what can be generally observed (in this case: 5 different non-0 buckets).
4 Linear increasing assignment on the bucketing interval was so defined that the starting point of the linear segment is max{0, scorestart - stepavg}, where scorestart is the score value of the lower limit of the lowest non-0 bucket, stepavg is the average step interval (bp), and its end-point is the score value of the lower limit of the bucket associate with the highest buffer rate. From the lower limit of the bucket associated with the highest buffer rate the assignment matches the non-increasing – constant – value of the highest bucket.
5 Navigating liquidity stress: operational readiness for central bank support
6 Emergency liquidity assistance (ELA) and monetary policy
7 https://www.bnb.bg/bnbweb/groups/public/documents/bnb_law/regulation_liquidity_supp_en.pdf
8 https://www.snb.ch/en/the-snb/organisation/legal-framework#geschaeftsbedingungen
9 https://www.worldpay.com/en-GB/global-payments-report
10 This measurement approach provides an upper estimate of the climate risk-vulnerable exposures of the designated sectors, which may be reduced, for instance, by the loans financing activities aligned to Union’s 2020/852 Taxonomy Regulation and the Union’s Regulation 2021/2139 supplementing the Taxonomy Regulation or activities aligned to other sustainable financing programmes, but even beyond these there may be significant differences between the climate change-related financial risks of activities performed in the sectors concerned. For example, Alessi and Battiston (2022) consider almost 100 per cent of the fossil and transport sector, 70 per cent of the construction sector, 50–100 per cent of energy intensive industries (depending on the sector), and 39 per cent of the utilities and mainly the electricity sector (depending on the share of renewable energy generation) as those with higher risk exposures.
11 See, for example, IFF-EY global risk management survey 2025 or OliverWyman 2024.
12 A similar approach and direction of research is recommended by the ECB (2025) for the assessment of the second-round financial impacts of cyber stress scenarios. The body of already available studies is still limited, focused typically on estimating the liquidity shortage caused by large banks temporarily dropping out of the payment system (for one or a few days). They leave open the question whether taking account of the operational and technological specificities of the cyber incident triggers in stress scenarios could be relevant in shaping second-round financial processes. By significant abstraction from these, their point of departure is the shutdown of banks’ payment functions. See: Duffie and Younger, 2019; Eisenbach et al. 2022; Kosse and Lu, 2022; Koo et al. 2022; Khiaonarong et al. 2025.
13 https://www.centralbanking.com/central-banks/financial-stability/7973308/sovereign-bond-yields-affected-by-weather-disasters-%E2%80%93-bis-paper
14 https://www.fsb.org/uploads/P160125.pdf; https://www.bis.org/publ/arpdf/ar2025e1.htm
15 Joint communication to the European Parliament, the European Council, the Council, the European Economic and Social Committee and the Committee of the Regions on the European Preparedness Union Strategy, 26 March 2025. JOIN (2025) 130 final
16 see: https://www.bis.org/publ/othp49.pdf
17 https://www.iosco.org/library/pubdocs/pdf/IOSCOPD224.pdf
18 https://www.bis.org/publ/othp49.pdf
19 For details see: https://www.bis.org/basel_framework/chapter/BCP/40.htm
20 see: DORA, Act CCXXXVII of 2013 on Credit Institutions and Financial Enterprises; MNB Decree No. 33/2021 (IX. 15.) on the Detailed Provisions Relating to Activities in Operating the Payment System; the MNB’s business continuity oversight recommendations